How AI And Data Visualization Personalized e-learning experiences

AI and data visualization are used in personalizing e-learning experiences. AI helps in designing learning experiences by providing educational content based on what learners want to learn and achieve.

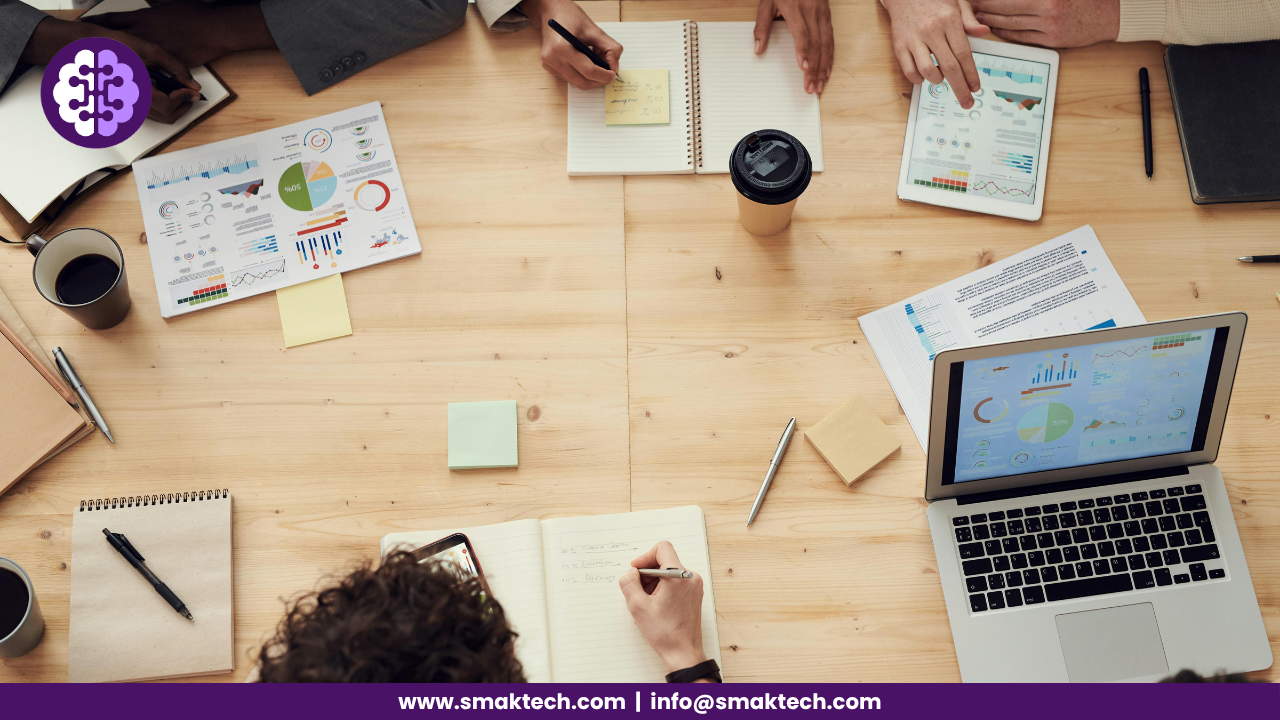
a group of people using their lapyop and writing something in their book with the help of technology.

AI and data visualization are highly used in personalizing e-learning experiences. AI helps in designing learning experiences by providing educational content based on what learners want to learn and achieve.

Transform learning with Smaktech. Click on the button below.

AI provides educational content on the basis of interests, skills and knowledge of the learners. AI provides training programs for working individuals and courses for individuals. Challenging assessment given to the learners to check their knowledge and provide assistance by identifying patterns and preferences of the users.

How data visualization personalizing learning experience

Data visualization represents data by using charts, graphs, diagrams, tables and more which makes it easier for learners to understand all the numerical data and help them to make decisions on the basis of it. Data visualization also provides the progress report which shows their learning progress and improvements, learner’s performance and skill enhancement. Data visualization supports self directed learning as learners can see and track their own progress by exploring data.

Types of data visualization

Charts and graphs: There are many types, such as bar charts, line charts, pie charts, scatter charts, area charts, funnel charts, and more.

Maps visualization: There are two kinds of maps: heatmaps and bubble maps.

Diagrams: It includes tree maps, sankey diagrams, and Gantt charts, which represent the process and relationship.

Violin plots show data distribution for one or more groups using density curves.

A density plot visualises the distribution of data over a continuous variable. 

Box plots, which focus on statistical analysis.

Infographics that show both visuals and text data.

Dashboards for analysis and presentation.

Benefits of AI and data visualization in learning experiences

these both are cost effective and useful for educators to save their time on tracking attendance and managing other things like students data.

Continuously help individuals to make improvements in the strategies of teaching and learning. 

Future prediction can be easier by combining both AI and data visualization.

Personalized learning through AI

Learner’s ability to critical thinking, decision making and other skills, knowledge and many more are to be analysed by AI and based on this information AI chatbots and visual assistants facilitates personalized learning through providing tutorials, suggesting resources to learn, on time feedback, solutions to the queries of the students.

Personalized learning through data visualization

Data visualization makes data driven decisions easiest. Learners can track their achievements, create progress report with the help of using graphs, tables, charts and other types of data visualization and visualize their strengths and weaknesses on specific skill sets. So, this is how learner can get mastery in such skills and personalized learning by data visualization.

AI and data visualization - combined personalizing learning education:

Combination of both AI and data visualization impact a lot in improving academic outcomes as it gives instructions by analysing their progress report. Learning becomes more fun and users would engage a lot through it.

Educators can use it in a combined way to get to know such learning methods according to student’s needs and performance.

Transform Learning with Smaktech . Click on the button below.

Advancement in personalized learning could be only possible by majoring in AI and data visualization and by using both in a combined way, it surely makes individuals more knowledgeable and progressive.